Home/Berwyn/Market Report

Berwyn Housing Market Report

October 2026 • Updated daily from MLS data

$420,926
Average Price
91
Active Listings
32
Avg Days on Market
$211
Avg Price/Sqft
0
New This Week

Inventory by Property Type

Active listings in Berwyn broken down by property type

Price Distribution

How Berwyn home prices are distributed across price ranges

Under $100K
0
$100K–$200K
9
9
$200K–$300K
12
12
$300K–$500K
45
45
$500K–$750K
21
21
$750K–$1M
2
2
$1M+
0

Listings by Bedrooms

Bedroom count breakdown for active listings in Berwyn

4
1 Bed
13
2 Bed
26
3 Bed
36
4 Bed
9
5+ Bed

Demographics & Community

Census data for Berwyn, Illinois

56,556
Population
$71,300
Median Household Income
36.3
Median Age
$272,900
Census Median Home Value

Housing Occupancy

Total Housing Units21,651
Owner-Occupied12,031 (60.4%)
Renter-Occupied7,873 (39.6%)
Vacant Units1,747
Median Rent$1,106/mo

Commute & Education

Median Commute26249 min
Work From Home3.9%
Public Transit4.3%
Bachelor's Degree+16.2%
High School Diploma+0.0%

Affordability & Housing Costs

HUD data for the Berwyn area

Fair Market Rent (2024)

Studio$1,399/mo
1 Bedroom$1,507/mo
2 Bedroom$1,714/mo
3 Bedroom$2,182/mo
4 Bedroom$2,583/mo

Income Limits (2024)

Median Family Income$112,100
Low Income (4-person)$89,700
Very Low Income (4-person)$56,050
Extremely Low (4-person)$33,650

Safety & Crime Statistics

Crime data for Berwyn (2024)

91
Violent Crimes
717
Property Crimes
76
Burglaries
119
Vehicle Thefts

School Districts

School districts serving Berwyn properties

98
100
201

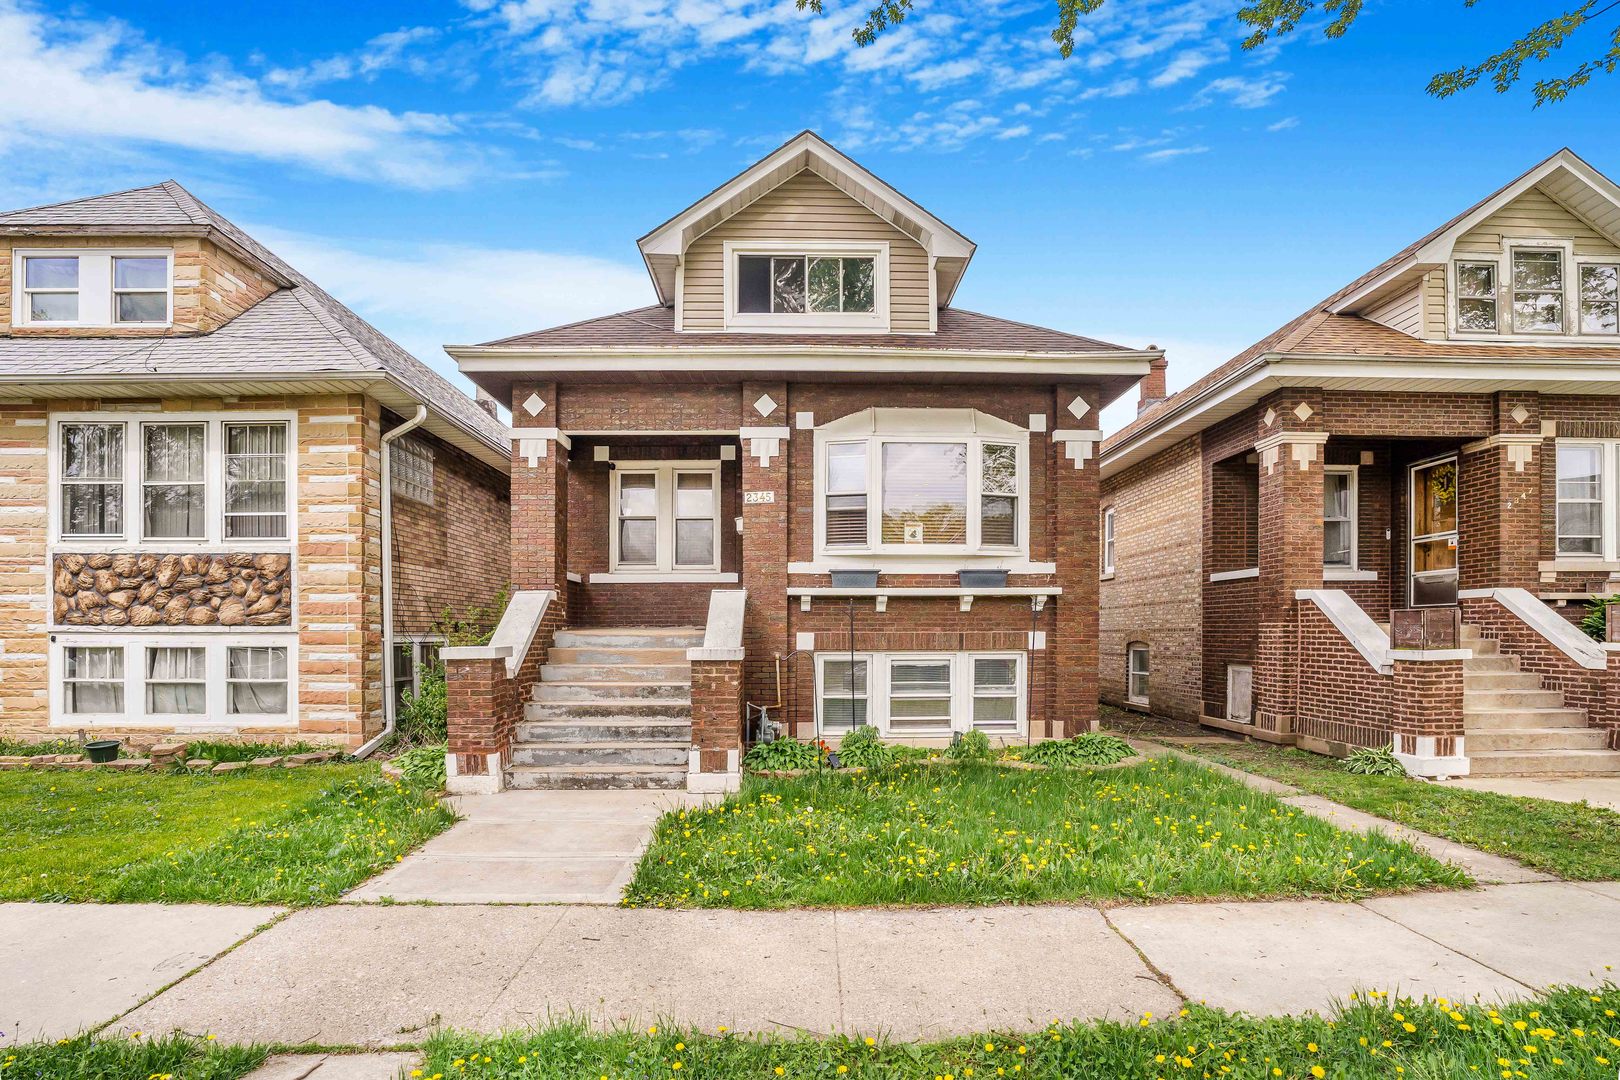
Featured Listings in Berwyn

Top properties currently on the market

Save $10,228 on the Average Berwyn Home

Traditional agents charge 3% commission ($12,628). With IvyGro, our broker keeps just $2,400 (negotiable at closing) and you keep the rest as your rebate.