Home/Niota/Market Report

Niota Housing Market Report

August 2026 • Updated daily from MLS data

$65,000
Average Price
1
Active Listings
8
Avg Days on Market
$54
Avg Price/Sqft
0
New This Week

Inventory by Property Type

Active listings in Niota broken down by property type

Price Distribution

How Niota home prices are distributed across price ranges

Under $100K
1
1
$100K–$200K
0
$200K–$300K
0
$300K–$500K
0
$500K–$750K
0
$750K–$1M
0
$1M+
0

Listings by Bedrooms

Bedroom count breakdown for active listings in Niota

0
1 Bed
1
2 Bed
0
3 Bed
0
4 Bed
0
5+ Bed

Demographics & Community

Census data for Niota, Illinois

13
Population
68.4
Median Age

Housing Occupancy

Total Housing Units25
Owner-Occupied9 (100.0%)
0
Vacant Units16

Affordability & Housing Costs

HUD data for the Niota area

Fair Market Rent (2024)

Studio$553/mo
1 Bedroom$680/mo
2 Bedroom$807/mo
3 Bedroom$1,043/mo
4 Bedroom$1,145/mo

Income Limits (2024)

Median Family Income$87,500
Low Income (4-person)$70,000
Very Low Income (4-person)$43,750
Extremely Low (4-person)$31,200

School Districts

School districts serving Niota properties

325

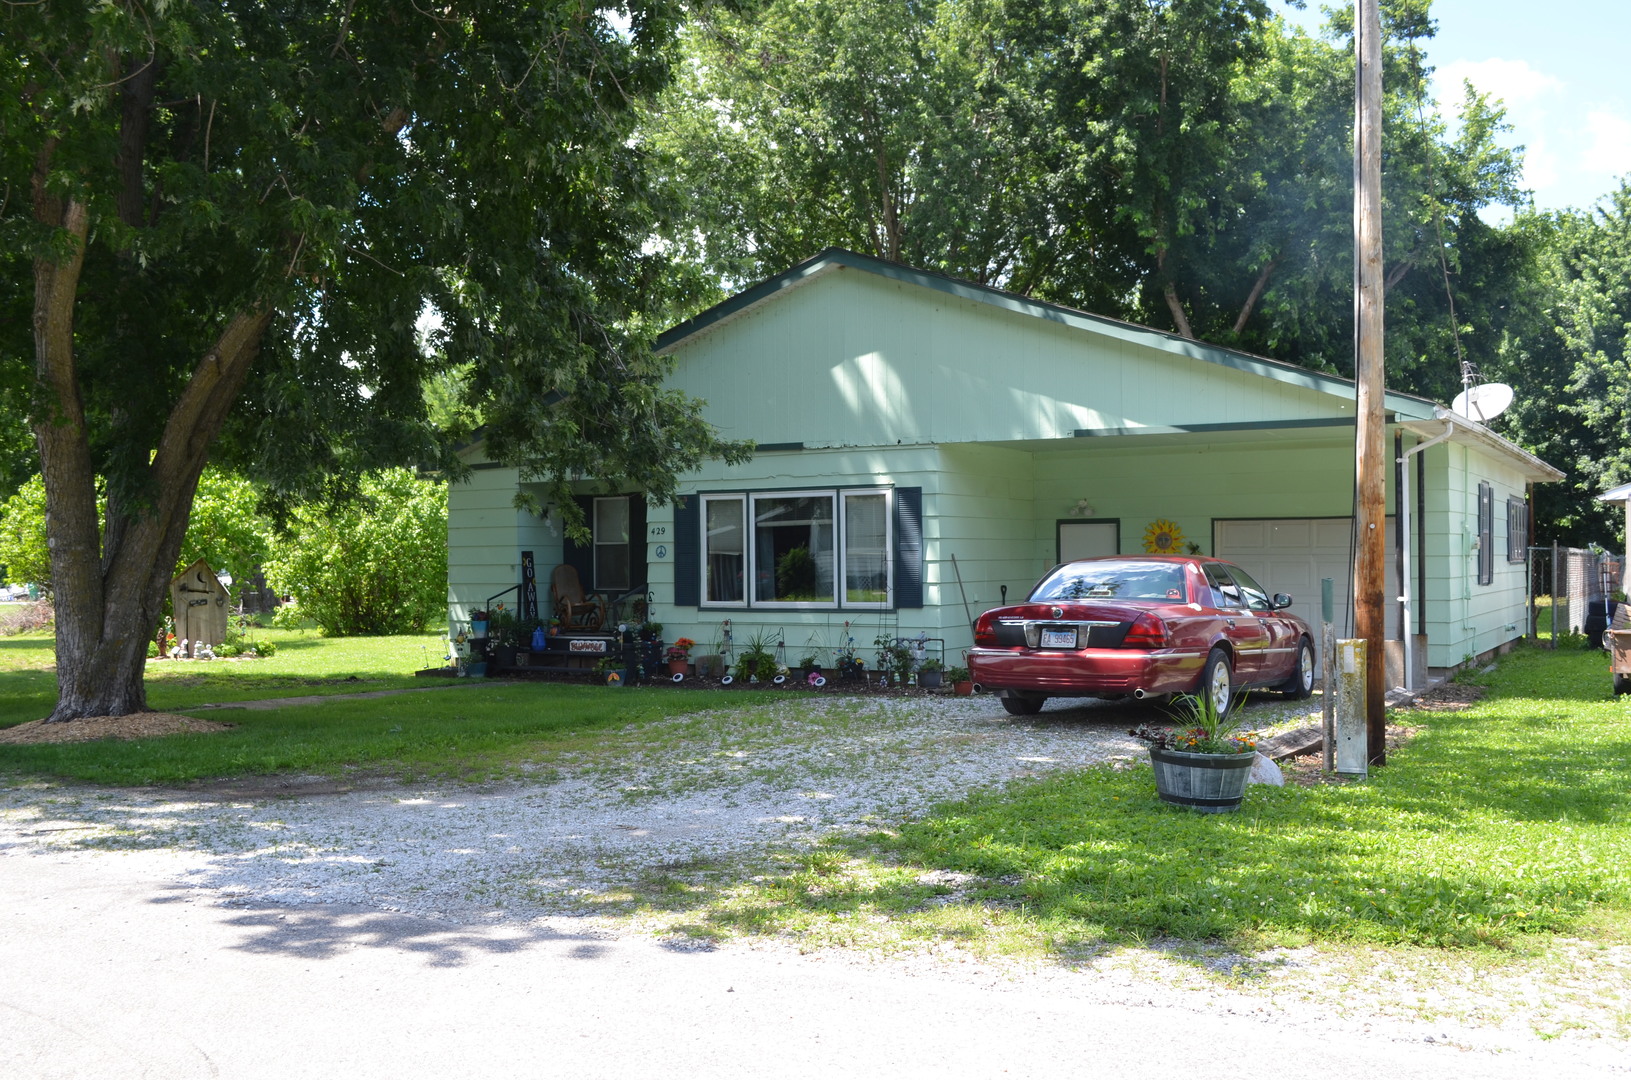
Featured Listings in Niota

Top properties currently on the market

Save -$450 on the Average Niota Home

Traditional agents charge 3% commission ($1,950). With IvyGro, our broker keeps just $2,400 (negotiable at closing) and you keep the rest as your rebate.